K-Means Clustering and Art
Cross posted from Google+.
My coworker at Google, Tony Rippy, has for a while been working on a fascinating problem. Take all the pixels of a photograph, and rearrange them so that the final image looks like an artist's palette -- something to which you can take a paintbrush and recreate the original image.
He's got some really good looking solutions which he might post if you ask him nicely. :-)
This turns out to be a tricky problem, and its hard to come up with an objective measure of the quality of any given solution. In fact, the quality is very subjective.
Anyhow, while studying the K-means clustering algorithm from ml-class, it struck me that k-means could be used to help with extracting a small palette of colors from an image. For example, by using each of the RGB channels as features, and euclidian distance as the similarity metric, one could run stock k-means to generate clusters of similar colors.
I coded up a quick R script to test this and got some interesting results. Here is an example of an image with its potential palette. Recall that the second image is simply the first image with the pixels rearranged.
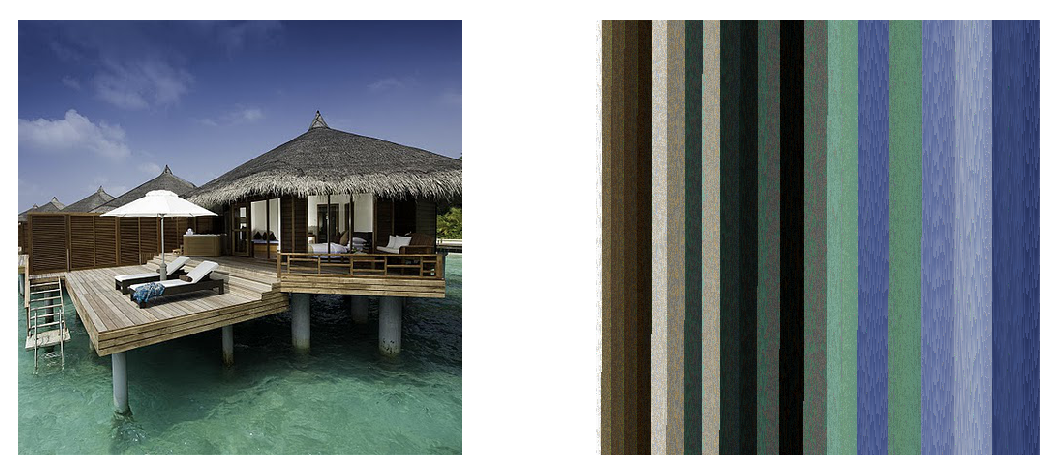
I experimented with various values of k (number of clusters) for the different images. It turns out that it's pretty hard to algorithmically pre-determine this number (although there are various techniques that do exist.) The water villa pic above has 15 clusters, the nursery pic below has 20, and the cartoon has 6.
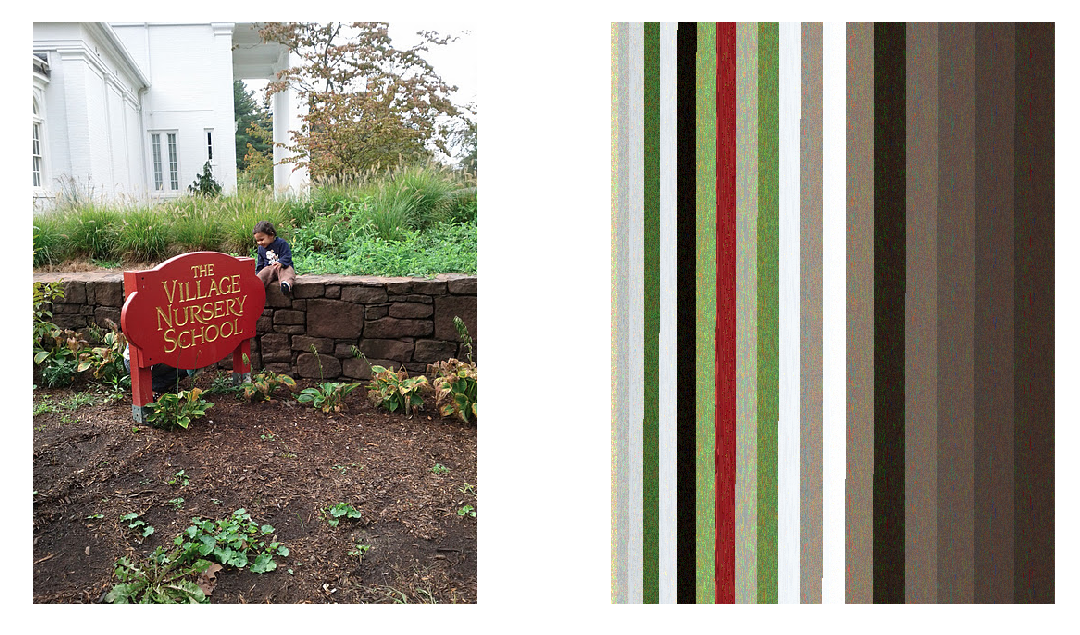
Note that this is only one subproblem of the original one; there is also the subproblem of placement, which I skirted around by simply arranging the colors in vertical bands across the final image. I'm pretty sure no artist's palette looks like this.
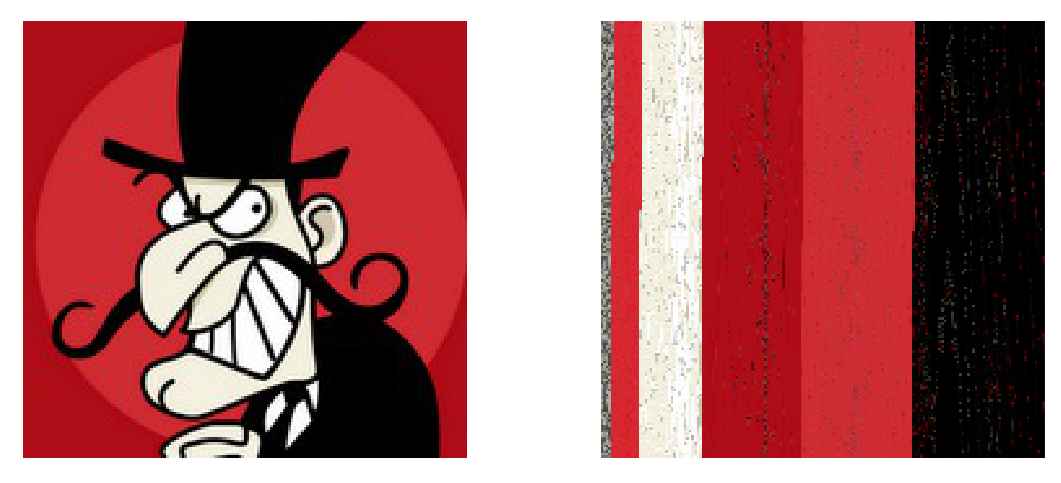
Also, these palettes aren't very "clean". Since the original pictures themselves are noisy, some of this noise arbitrarily creep into the various clusters. Working with a filtered version of the picture would be cheating, so we won't do that. But we might be able to extract the noisy pixels, put them in a special cluster, and run k-means on the remaining pixels.
Okay, enough talk. Here's the code: https://github.com/0xfe/experiments/blob/master/r/palette.rscript
First install cclust and ReadImages packages from CRAN, and try out the algorithm in an R console:
> source('/path/to/palette.rscript')
> plot_palette('/path/to/some/image.jpg')
This will produce a plot with the original image and the transformed one next to each other, like the attached pics below. It uses 10 clusters by default, for a palette of 10 colors. You can change this by passing the cluster count as the second parameter to plot_palette.
> plot_palette('/path/to/some/image.jpg', 20)
That's all folks!
18 comments (imported from blogger)
@Anonymous1:
@Zoheb: Dimensionality reduction is kind of "cheating", because data is lost, and you're not really rearranging the pixels.
@Anonymous2: Ordered by cluster size.
Without these constraints, the problem becomes much simpler. :-)
https://github.com/tylerneylon/imghist/blob/master/imghist.py
It includes python-native k-means clustering code which is all of 36 lines, and could definitely be made shorter if one wanted to. Here is some sample output of that code, where I use a pie-chart-like layout:
http://blog.zillabyte.com/post/11193458776/color-as-data
@Austin has a great suggestion to use the L*a*b colospace, which does make a lot of sense here, and which I hadn't heard of before -- good idea!
A few tweaks of the HSV values to bump (read-recover) saturation and a bit of sharpening and that usually renders a nice abstract palette selection from a source image.
If you aren't too insulted by a recovering programmer adding his opinion, I would be happy to make a video of the process on an arbitrary image or a provided one.
http://webcache.googleusercontent.com/search?q=cache:QA6jEYzJd0QJ:cran.r-project.org/package%3DReadImages+ReadImages+site:r-project.org&cd=1&hl=en&ct=clnk&gl=us
Can you tell us more about what the width of each line represents?.. i.e. is the area of each color in the result representative of all the pixels of that color in the original image?
There is no standard conversion from RGB to XYZ. IMHO it was a huge mistake to ever publish an example RGB -> XYZ conversion matrix that assumed certain camera primaries. Now people just use it and assume they have XYZ. They don't. I have even read "scientific" papers that present algorithms for perceptually uniform color matching and use the "standard" conversion matrix.
Even if you did have real XYZ, you must know the white point of the camera as well. If you don't know the XYZ color coordinates of white color in the illumination the image was taken, you cannot get L*a*b*.
One final note. I don't want to downplay you, but clustering colors with k-means is not new. It is a rather conventional way of reducing color spaces and many other feature spaces. Another technique used for this is called learning vector quantization (LVQ). This happens to me all the time. Every time I come up with a great idea somebody tells me it is already patented or something. But anyway, go with RGB :)